
The Growth and Development of Urban Centre in Kuala Lumpur: An Analysis on Growth Centre Development Control

Written by Izuandi Yin, and Jamalunlaili Abdullah.
School of Housing Building and Planning, Universiti Sains Malaysia, Faculty of Architecture, Planning & Surveying, Universiti Teknologi MARA, Shah Alam.
Abstract
The urban economics of Kuala Lumpur city centre is becoming a higher contribution to the Gross National Income for Malaysia. Identifying the boundary’s limit for an urban centre in Kuala Lumpur is quite challenging. The development control which creates the growth of Kuala Lumpur defines that allocation of development control for City Centre Commercial (CCC) development within the District Centre Commercial (DCC) development gave different priorities and growth for some area, unbalanced land use distribution within Kuala Lumpur areas, plot ratio prioritization base on the nearest urban centre to the CCC area and low enforcement on determining the distribution of floor space. The objective is to identify the urban growth pattern, to examine the influence of built-up development. Using the qualitative method in allocating the intensity development Kuala Lumpur’s Urban Centre. This analysis is made to study the intensity and the built-up area correlates with the floor space area, plot ratio, density development and gross development value (GDV). The finding for land use and intensity development correlates with the development control in determining the rank or urban growth. In the end, it is resulting in the hierarchy of development growth of 11 growth centre in Kuala Lumpur.
1. Introduction
There are 11 Growth Center in Kuala Lumpur contributing RM 357.4 billion [1] to the nation's Gross National Income (GNI) in an area of just 94 square kilometres (243 square kilometres) in the fourth quarter of 2020. The construction sector contracted 13.9 per cent from negative 12.4 per cent in the preceding quarter. This is in line with the average of value work done per project decreased in the fourth quarter of 2020. The contraction in the construction sector was due to negative growth in residential and ono residential construction as well as civil engineering. The COVID-19 pandemic that hit the world has affected the Malaysian economy with negative growth of GDP for the construction sector decreased 19.4 per cent (2019: 0.1%) [1] especially during the Movement Control Order (MCO). This study explains the intensity development for each growth centre and those growth centres need to be rank and classified by doing the measurement for the urban economic growth to get the finding for each growth development. The latest rank can also be identified base on the capacity of development control in monitoring the growth centre [3]. This research is to analyse urban growth, development control for a different hierarchy of Kuala Lumpur’s urban centre. The objective of this research was to identify the urban growth rank, examined the influence of development control towards the development growth of the urban centre, determining the urban growth centre for development decision and the use of tools of development control in the intensity development which recommend urban development growth to have proper management and good development control. The major project in Greater KL has resulted from the allocation of iconic place [4] and skyscraper building such as Petronas Twin Tower, The Exchange 106 and the upcoming completion of Merdeka 118 building which will influence the rapid development around it with RM40 Billion of Gross Development Value [8]. Urban growth development is related to several themes such as development control for intensity development. This will result in the built-up area, land use within cities, urban transportation, zoning of land use, the value of land, floor space and development density. In KL City Centre metropolitan area focusing on this related theme which comes to the transportation, land use, development density and built-up area where the major aspect contributes to the urban growth in the city centre. The approval of planning permission both from building plan and urban planning permission giving the right to the construction of new development [10]. Solving the unclear boundary in the urban area with a targeted of 314 cities in Malaysia for the next 4 years in 2025 [7].
2. Methodology
The method used in this study is a Preliminary Study on the development of the urban centre to know the development growth that occurs in the area that has the built-up area in term of the relation between urban centre with surrounding district centre in Kuala Lumpur. It involves determining the study area focus on the growth centre of Kuala Lumpur Federal Territory based on secondary information collected. The process of identifying the purpose of the study is conducted, to support the implementation of research objectives, scope and research issues and problems in the study area. The second stage is Literature Review with theoretical study related to urban growth development and element in development control. This theoretical study is done using KL City Plan 2020, Act and policies, Planning Guidelines and Standards, journal and KL Structure Plan. The third stage is Data Collection which both Qualitative and Quantitative approaches used throughout this research. Data requirement consists of two-part such as primary and secondary data. Primary data involves observation and mapping (Qualitative Method) to know the intensity development of the urban centre which is to calculate the actual plot ratio for each building, gross development value for each building, building height in term of floor level, floor space of the building, and also a built-up area for each lot. This observation also relates to others area around the city centre to see the difference in the built-up area given by KL City Hall in the allocation of high plot ratio by considering the market forces of that place. Observation or surveillance method has involved with outdoor work like study area inventory to find the issue and problem in the study area. The other method used in this study is interview using a questionnaire (Qualitative Method) with government agencies perception to get the data related to the development control. The discussion also being carried out on the professional government worker (KL City Hall staff) to know the built-up area, defining the plot ratio, site decision for development and current situation about the urban development matters in Kuala Lumpur. Some computer software that helps in the work of processing and analysing data is ACAD, GIS application, Microsoft Office (Word, Excel and PowerPoint) and SPSS. It also sketches the results and information obtained from the survey will be processed in the form of plans using AutoCAD and MapInfo installer. The fourth stage is Data Analysis involves the analysing of the data that has been collected to respond to the issue and scenario of urban growth development in Kuala Lumpur, and its process occurs after field study. Analysis and data processing use descriptive analysis, comparative analysis, trend analysis, concentrate analysis SWOT analysis and matrix analysis. The findings could help the reserves in knowing the growth of urban centre through development control. Then a comparative study conducted on the actual site to determine the measurement result of the element in land use optimisation to know the location decision [9] and the level of growth for each urban centre. While land use development also gives influence to urban growth. This interrelationship creates the main element that responds to the development of urban growth for each urban centre and also economically influenced urban growth. Six elements have been analysed and identified to know the growth of each urban area base on this development control element. Getting the floor area from the level of the building, plot ratio and build up area. The Gross Development Value (GDV) for development intensity comes from the estimation for each phase of development and the cost of the development. The Floor space for each building located in the urban centre usually been measured for the total floor space in square feet. The building level influenced by the height control within the city. Last but not least is the mix of land use for each urban centre that creates the pattern of growth.
3. Research Area
There are 11 selected Growth Centre with a radius of the 1km study area for each urban centre. Those chosen areas in the District Centre and Neighbourhood Centre is based on the importance of the commercial area in Kuala Lumpur. It has been selected for comparison with another growth centre. The difference between the growth centre will be measure base on the intensity development of the selected area that contributes to the urban growth and urban economic for the city.
Table 1. Selected Growth Centre
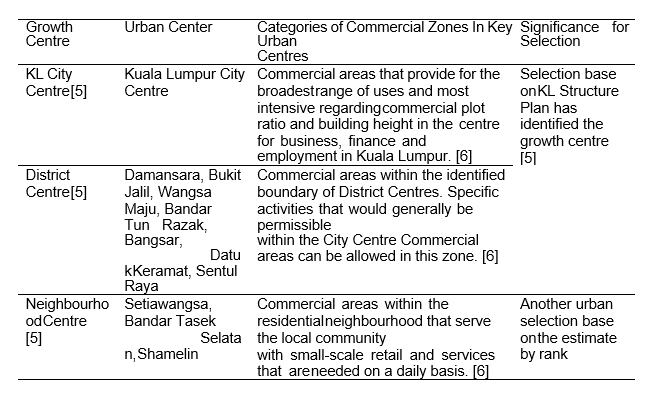
The selection of the case study base on the existing District Centre in KL which is Damansara, Bukit Jalil, Wangsa Maju and Bandar Tun Razak. 3 other District Centre analysed which is Bangsar, Datuk Keramat and Sentul Raya. Another 3 areas from Neighborhood Center which is Setiawangsa, Bandar Tasek Selatan and Shamelin. The selection is based on the KL Structure Plan 2020 which has identified the City Centre and District Centre Neighborhood Center selected by the own selection because of the criteria and the growth development that it feels like can compete to be listed or rank in high growth centre. KL City Centre is already in Tier 1 or city centre growth area so that it can be estimated to compare with other growth centres. But for the rest 10 growth centre is measured with intensity development and growth development by doing observation survey to get the rank and comparison for each place.
4. Research Findings
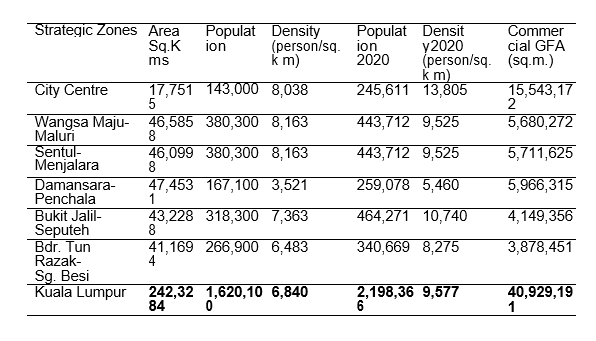
The decreasing of National GDP during the MCO at the first and second quarter of 2020 (RM344.1 Billion to RM289.4 Billion) lead to the inhibit construction. Table 2 below referred to the strategic zone which divided into two growth centre which is City Centre and District Centre. Wangsa Maju- Maluri and Sentul- Manjalara showed the highest density in Kuala Lumpur with 8,163 person/square kilometer and expected to increase to 9,525 person/square kilometer by the year 2020. That resulted in 116% increase rate in population density. The Lowest density is Damansara-Penchala with 3,521 person/ square kilometer. From the table, it clearly shows that people move to the greater urban area because of the market force and job opportunity close to the workplace. The linear development along the main road influenced by the development of railway and transit area especially for MRT, LRT and Monorail resulting in the commercial activity is focusing on the transportation area. 41 million meter square of floor space in 2018 has been constructed with [5] commercial building, while a total of 65 million meter square [2] in the year 2020. The committed Gross Floor Area (GFA) gained is 14,916,008 meter square [5] and increase to 41,275,508 meter square [2] in 2020. That resulted in a 277% increase which tripled the rate in commercial floor space.
Table 2. Population, Density and Floor space Analysis [6]
Urban growth calculated based on the area of each development area (land lot and building lot) in order to get the built-up area and plinth area. The Gross Development Value (GDV) has been counted to get the land value which lead to the urban area land market demand.
Table 3. Urban Growth Analysis on Selected Growth Centre (1km radius)
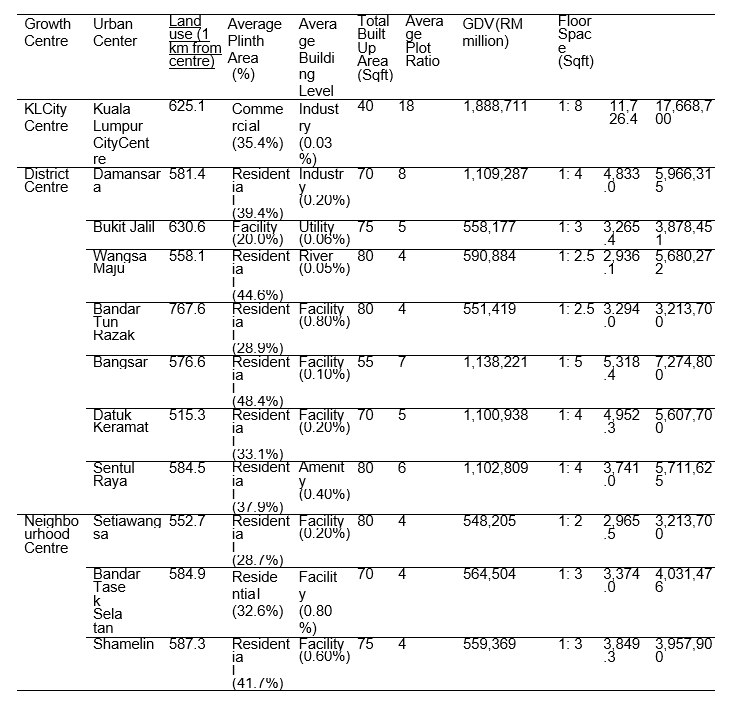
Table 3 shows the urban growth analysis for the selected growth centre which included the calculation and measurement on plinth area and building level and acreage to get the total number of built-up area. The data of the plinth area and level of the building gathered from the observation of each development built up in every urban centre. The rank of built-up area base on the function of growth centre is different in order of growth which is the first rank is city centre: Kuala Lumpur (19.5%); second until the sixth rank is district centre: Bangsar (11.7%), Damansara (11.5%), Sentul Raya (11.4%), Datuk Keramat (11.3%) and Wangsa Maju (6.1%). Seventh and eighth rank is neighbourhood centre: Bandar Tasek Selatan (5.8%) and Shamelin (5.7%), while ninth and tenth rank is district centre Bukit Jalil (5.7%) and Bandar Tun Razak (5.6%) and the lowest rank of built-up area base on growth centre is neighbourhood centre Setiawangsa (5.6%). From the rank, the result shows that non- ordering of growth centre from the total built-up area for each urban centre. It shows that from the first rank until the sixth rank follows the natural order of growth centre but there are neighbourhood centre has been increasing their built-up area to been located at the seventh and eighth of the growth centre rank. Furthermore, in the ninth and tenth rank of the growth centre is still in the lower built-up area and their position has been replacing by Bandar Tasek Selatan and Shamelin that has a more magnificent built-up area compared to them (Bukit Jalil and Bandar Tun Razak). Setiawangsa is still in the lowest built-up area among other urban centres. Matrix analysis used for each variable in growth criteria in Kuala Lumpur which is in plot ratio, GDV, floor space and built-up area score to determine the importance and the rank for each urban centre with the total score for the growth in Kuala Lumpur is 220. The highest growth score is Kuala Lumpur City Centre with 40 total scores represent 18.2% of Kuala Lumpur growth. Damansara with 22 total scores by 10% of overall growth, Bukit Jalil with 16 total scores represent 7.3% from overall growth, Wangsa Maju with 16 total scores represent 7.3% from overall growth, Bandar Tun Razak with 13 total growth represents 5.9% from overall growth, Bangsar with 26 total scores represent 11.8% of overall growth. Furthermore, Datuk Keramat with a total growth score of 22 represents 10% of overall growth, and Sentul Raya with total scores of 21 represent 9.5% of the overall growth's score. Setiawangsa with a total growth score of 11 represents 5% of overall growth, and Bandar Tasek Selatan with a total score of 16 represent 7.2% of the overall growth score. Last but not least is Shamelin with a total score of 17 represent 7.7% of overall growth. The score of every variable of growth which is plot ratio score with 61 (27.7%) from the overall variable growth score. Gross Development Value with a total score of 47 (21.4%) from the overall variable growth score. The floor space total score and built-up area total score were both represent 54 scores (24.5%) and 58 scores (26.4%).
4.1 Urban Centre Growth Finding
From the built-up area, analysis analysed the non-ordering of growth centre from the total built- up area for each urban centre. There are neighbourhood centre has increased their built-up area to been located at the seventh and eighth of the growth centre rank. Furthermore, in the ninth and tenth rank of the growth centre is still in the lower built-up area and their position has been replacing by Bandar Tasek Selatan and Shamelin that has a more magnificent built-up area compared to them (Bukit Jalil and Bandar Tun Razak). Setiawangsa is still in the lowest built- up area among other urban centres. The first rank of growth centre is Kuala Lumpur City Centre and the second rank is Bangsar followed by Damansara and Datuk Keramat share the position of the third rank, then the fourth rank which is Sentul Raya and fifth rank are Shamelin. But from the analysis show that the sixth rank is from the neighbourhood centre, so it shows that this urban centre is higher than the urban centre in the seventh rank which is Bandar Tun Razak are in the group of District Centre. So that these two urban centres have their rank on the actual site. Shamelin has the potential to upgrade its growth centre from the neighbourhood centre to the district centre, while Bandar Tun Razak can be classified as a neighbourhood centre. While the remain two urban centres in the Neighbourhood Centre which is Bandar Tasek Selatan and Setiawangsa is still be classified as Neighbourhood Centre because their position both is in sixth and eighth rank. The growth centre has been affected by the significance of the growth with its rank in Kuala Lumpur. The area in KL CP 2020 (Bandar Tun Razak and Shamelin) and KLSP 2020 (Bandar Tun Razak, Datuk Keramat, Bangsar, Sentul Raya and Shamelin) is categorised as the area that has been affected to be transferred by looking at the growth rank. There is an area that supposedly being classified as a Neighbourhood centre commercial in KLCP 2020 which is Bandar Tun Razak. Furthermore, Shamelin classified as Neighbourhood Centre Commercial in KLCP 2020 has significance by its growth rank to be located in the District Centre Commercial group. There is a centre which is higher growth compare to Bandar Tun Razak which is Datuk Keramat, Bangsar, Sentul Raya and Shamelin were supposedly being rank in the District Centre.
5. Conclusion
From table 4 shows the growth centre base on KLCP 2020 and KLSP 2020. It shows the growth centre that has been affected by the significance of the growth with its rank in Kuala Lumpur. The area that has been highlighted in the table inside figure 1 both in KL CP 2020 and KLSP 2020 is categories as an area that has been affected to be transferred by looking at the growth rank. There is the area that supposedly being classified as a Neighbourhood centre commercial in KLCP 2020 which is Bandar Tun Razak (highlighted in red) because ranked in the 7th centre in growth analysis of Kuala Lumpur. Furthermore, Shamelin classified as Neighbourhood Centre Commercial in KLCP 2020 (highlighted in green) has significance by its growth rank (5th) to be located in the District Centre Commercial group. Besides, there is the centre which is more significant of growth (highlighted in green) compare to Bandar Tun Razak which is Datuk Keramat (3rd), Bangsar (2nd), Sentul Raya (4th) and Shamelin (6th) were supposedly being rank in District Centre. From the analysis that has been done identify the growth of Kuala Lumpur can be measured from the land-use optimisation which is the estimation of plot ratio, floor space, measure the built-up area from the development and gross development value for the intensity development for each urban centre. The finding clearly, show that there is the urban centre that has classified in KLCP and KLSP is outdated, and the results show there is a neighbourhood centre area that needs to be classified in the district centre because the growth is growing high than the area in district centre that still on the same growth.
Table 4. Finding of Growth by rank in Kuala Lumpur
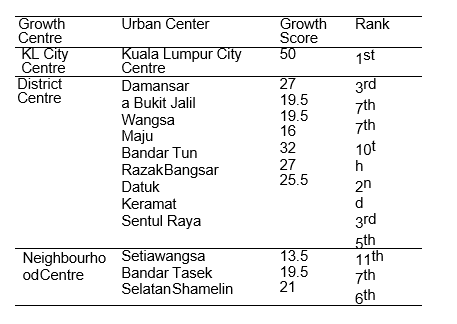
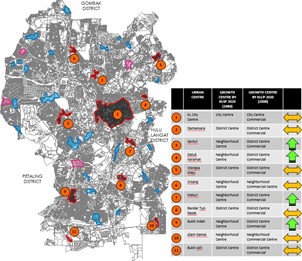
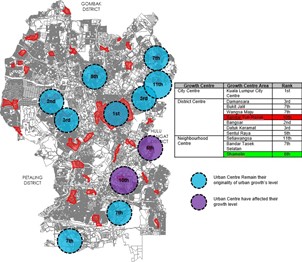
Fig. 1–Overlay Mapping from KL City Plan - KL Structure Plan (left) and Finding of Growth Rank (right).
Figure 1 above is the result of overlay analysis for the urban centre from KLSP 2020 and urban centre from KLCP 2020. The result has identified 11 urban centres that have been the overlay and show that the mismatch of growth centre that has been employed by Kuala Lumpur City Hall. This analysis also has answered a part of the main problem statement for this research. The result shows that 7 of the urban centre were remained and maintain with no changes while 4 other urban centres (Sentul, Datuk Keramat, Maluri and Bukit Indah) have increased their position of growth from Neighborhood Centre to District Centre Commercial. Next is the identification of land use for each urban centre were categories with its use of land and building use.
6. Acknowledgements
The authors would like to thank our main sponsor, Ministry of Higher Education Malaysia through Fundamental Research Grant Scheme (203.PPBGN.6711884) to avail this study. The credit also goes to School of Housing Building and Planning, Universiti Sains Malaysia, Pulau Pinang for the encouragement and support during the preparation of this paper.
7. References
1. Department of Statistic Malaysia (2020). Press Release Malaysia Economic Performance Fourth Quarter 2020. Jabatan Perangkaan Malaysia. Retrieved from: https://www.dosm.gov.my
2. Draft Kuala Lumpur Structure Plan 2020: A World Class City (2018). Dewan Bandaraya Kuala Lumpur. Retrieved from http://www.dbkl.gov.my/pskl2020/english/index.htm
3. Izuandi, Y., and Jamalunlaili, A. (2020). The Development Control of Urban Centre in Kuala Lumpur, Planning Malaysia: Journal of Malaysian Institute of Planners, 18(3), 313-325.
4. Izuandi, Y., Mou, L.T., Tew, Y.L., Diana, M., Abdul, G.O. (2019). Monitoring Land Use Pattern And Built- Up Expansion In Kuala Lumpur City Centre. The European Proceeding of Multidisciplinary Sciences (EpMS), 2019, ISSN 2421-826X
5. Kuala Lumpur Structure Plan 2020: A World Class City (2004). Dewan Bandaraya Kuala Lumpur, 2004. ISBN 9839983245, 9789839983241
6. Kuala Lumpur City Plan 2020: Towards a World Class City. Dewan Bandaraya Kuala Lumpur, 2008. ISBN9839983288, 9789839983289
7. National Urbanization Plan 2 (NUP) 2016. Jabatan Perancangan Bandar dan Desa Semenanjung Malaysia. Kementerian Kesejahteraan Bandar, Perumahan Dan Kerajaan Tempatan. Julai 2016. ISBN 978-967-12812- 3-9
8. Prime Minister’s Department (2016). Economic Transformation Programme, Annual Report 2016.Performance Management and Delivery Unit (PEMANDU).
9. Siedentop, S., Fina, S. and Krehl, A. (2016). Greenbelts in Germany's regional plans—An effective growth management policy?. Landscape and Urban Planning Journal. Vol. 145, p. 71-82. January 2016
10. Yusup, M., Arshad, A.F., Marzukhi, M.A., Abdullah, Y.A. (2018). Temporary Planning Permission In Development Control System For Urban Development, Planning Malaysia: Journal of Malaysian Institute of Planners, 16(3),143-155
Authors Biography
Izuandi Yin is a lecturer in Urban and Regional Planning Program, School of Housing Building and Planning, Universiti Sains Malaysia. He is a graduate town planner of Board of Town Planners Malaysia and Malaysia Institute of Planners. He graduated from MSc. Urban Development and Management, Bachelor of (Hons) Town and Regional Planning and Diploma of (Hons) Town and Regional Planning from Universiti Teknologi MARA. He was a former lecturer at Limkokwing University of Creative and Technology, former town planner in Urban Acres Consultant and developer Laman Langat Resources. His expertise is in Planning Permission for physical development and development control.
Jamalunlaili Abdullah is a Professor at the Center of Studies for Town and Regional Planning and current Dean of Faculty of Architecture, Planning and Surveying, Universiti Teknologi MARA. He is a registered town planner (TPr) of Board of Town Planners Malaysia and Malaysian Institute of Planners. He received his B.Sc (Urban and Regional Planning) from East Carolina University, USA. He continued his Master in Urban and Regional Planning at Virginia Commonwealth University, USA and his PhD in City & Regional Planning at Cornell University, USA. His expertise is in urban and regional planning, economic development and social planning.
This research paper was presented at the 2021 CABE Malaysia Chapter online Conference.
You can watch the conference in full.
Related Content

Jobs

Permanent
Construction Project Manager - BESS

Permanent
Associate Structural Engineer

Permanent
Assistant Quantity Surveyor
Permanent